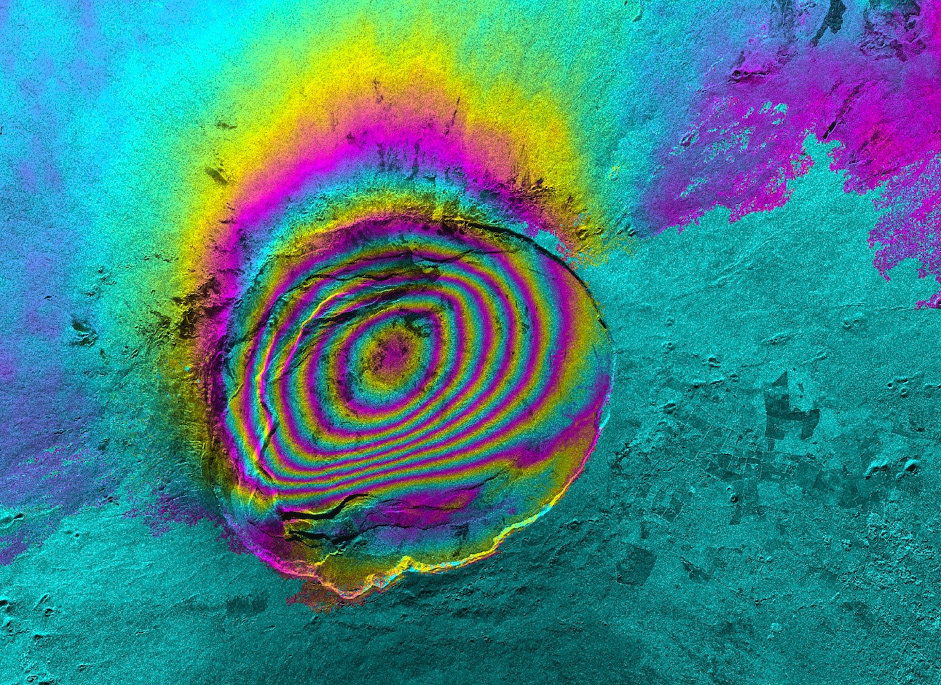
Interferometry is an imaging technique in which waves are superimposed in a manner to cause interference. NISAR will use interferometry to compare three-dimensional observations of the same scene on Earth to reveal surface motion and change.
Interferometric synthetic aperture radar (InSAR) techniques combine two or more SAR images over the same region to reveal surface topography or surface motion. If the combined SAR images originate from slightly different positions, the topography of the surface can be mapped. In contrast, if images from the same position but taken at different times are combined, the difference between them will show motion, or deformation, of the surface in the time between the two images.
The image produced is known as an interferogram. It looks a bit like a rainbow-colored oil slick on the surface of water. This “fringe” of colored pixels shows the difference in signal phase received by the radar instrument over time, which shows what has changed in the image. The fringe’s rainbow bands repeat across the image in a manner corresponding to half the wavelength – in the case of the L-band, 12 cm. An abrupt color change in the fringe can be measured relative to the fringe's color pattern.
Unlike SAR, which makes use of both a wave’s amplitude (signal strength) and the phase of the returned signal, interferometry is only concerned with the difference in phase from multiple passes or positions. Phase is affected by interaction with the ground surface (both static and movement), the satellite's position in orbit and topography. To reveal movement on the ground, such as from a landslide or along an earthquake fault, the parameters affecting phase must be compensated for and removed from the final interferogram.
The radar signal reflected back from a single resolution unit, i.e., one pixel, is a combination of many targets or “scatterers” on the ground – trees, mountains, buildings, etc. This means that the signal returned to the radar can be random and unrelated to the adjacent unit/pixel signal if there are objects scattering the signals in many directions. However, as long as this combination of objects is consistent – those trees, mountains and buildings remain unchanged – the reflected signal for a single unit will maintain the same initial characteristics over time. In producing the interferogram, consistency in the signal will be canceled out because the wave’s phase will remain the same. (As a side note, interferometry does not work over water because its surface is constantly changing.)
The distance to a single resolution unit on the ground also varies with orbital effects on the satellite. The change in perpendicular distance from satellite to ground is known as the “baseline.” A satellite moves regularly and smoothly in space and the change in baseline distance on a particular orbit will be similar over many unit observations, allowing the change in phase can be modeled and removed as well.
As for surface topography, either it can either be derived or a pre-existing digital elevation model (DEM) can be used. With a slight difference in radar position, change in topography causes a slight distortion in the phase, much like a stereographic image where each eye sees a slightly different image that combines to produce a 3D effect. Using the known baseline distance, the height of the surface can be derived from multiple observations and a DEM created. The topography can then be corrected for in the phase and the image pixels rearranged to correspond to latitude and longitude in order to produce a correct “geocoded” projection.
When the contributions of the ground surface, orbital effects and topography to the signal’s phase are removed, in simplistic terms (without delving into sources of additional error), what remains in the image is the change in surface movement or deformation.
In an interferogram, the two SAR images are aligned on a pixel-by-pixel basis and the fringe color cycles represent units of the radar wavelength. The image can be read much like a topographic map, whereby the difference in surface displacement can be ascertained by the spread of the fringes. Close, compact fringes show greater surface movement and wider fringes show gentle to no change as seen from the radar’s line of sight. An abrupt change in fringe is indicative of greater motion, often seen where an earthquake fault ruptured and violently offset, or in the aftermath of a landslide.
For the NISAR mission, interferometric observations of any given point on the ground are acquired every 12 days. To the extent that the ground does not change appreciably in most places over 12 days, surface motion can be measured. From the NISAR science orbit, the instrument’s pointing accuracy is such that the L-SAR data can be used to produce repeat-pass interferograms sensitive to large-scale land deformation rates as small as 4 mm per year. Applications of interferometry include natural hazard monitoring of earthquakes, volcanoes and landslides, analysis of ground subsidence and structural integrity, and the motion of glaciers.
